
Short answer: there is no minimum. For a quantitative thesis the defensible number comes from an a priori power analysis in G*Power — you supply the effect size you expect, your alpha and your target power, and it returns N. For a qualitative thesis there is no calculation at all, and the authors of the most-used method now advise against claiming saturation.
The question arrives in one of two states: a committee member has asked how you arrived at your number, or recruitment has stalled at 47 and you need to know whether 47 is a problem. Different problems, different answers, both answerable tonight.
Is there a minimum number of participants for a thesis?
No Canadian school of graduate studies publishes one, and no methods textbook can, because the number depends entirely on what you are trying to detect. A study looking for a very large difference between two groups needs far fewer people than one looking for a small correlation.
What you will meet instead are conventions circulating as though they were rules — 30 per group, 10 cases per predictor, “at least 100 for a survey”, 12 interviews. Each is a heuristic published for one specific design, and each will be challenged if you offer it as your justification. The defensible move is not a better rule of thumb: it is to replace the rule with a calculation, or, where none exists, with an argument.

How do I calculate a sample size for a quantitative study?
With G*Power, which is free, runs on Windows and macOS, and is what most Canadian supervisors will expect to see named in your methods chapter. It is distributed by the Heinrich-Heine-Universität Düsseldorf, and its own terms are worth knowing: it is free for everyone including commercial users, and both the macOS and Windows versions “run locally on your computer and do not communicate with any servers anywhere” — which also means nothing about your study leaves your machine.
Two version details matter in 2026. The current Windows release is 3.1.9.7; the current macOS release is 3.1.9.6, compiled for Intel processors. The authors note that Apple supports Intel-built applications until macOS 28, expected in autumn 2027, and that a native Apple silicon version — G*Power 4 — is in development and anticipated well before then. On an M-series Mac it still runs; plan for the transition rather than be surprised by it.
G*Power offers five types of analysis, and choosing the wrong one is the most common error:
- A priori — sample size N is computed as a function of power (1 − β), significance level α, and the effect size you want to be able to detect. This is the one you want when planning.
- Sensitivity — the effect size is computed as a function of α, power and N. This is the one you want when N is already fixed.
- Compromise — both α and power are computed from the effect size, N and an error-probability ratio q = β/α.
- Criterion — α and the decision criterion are computed from power, effect size and N.
- Post hoc — power is computed from α, the effect size and N.
A worked example from the program’s own manual, so you can reproduce it exactly and check your installation is behaving: a one-tailed two-group t test, a medium effect size of d = .5, α = .05, power = .95, allocation ratio 1 returns a total sample size of 176 — 88 per group. Note how large that is. Most students are startled by their first honest a priori calculation, and that reaction is the useful part of the exercise.
A second worked example, for a one-way ANOVA with ten groups, a medium f = .25, α = .05 and power = .95: the manual reports a total sample size of 390, or 39 per group, with a critical F of 1.90, numerator df 9, denominator df 380, and an actual power of .952. That last figure explains a small oddity you will see: the achieved power is usually a little above what you asked for, because non-integer sample sizes are rounded up.
What effect size do I put in the box?
This is the input that decides everything, and the one students guess at. There are three legitimate sources, in descending order of strength:
- A prior study measuring the same thing in a similar population. Best answer. Take the effect size from the paper, and if the paper reports means and standard deviations instead, G*Power’s Determine button opens a drawer that will compute the effect size from those raw parameters for you.
- A meta-analysis in your field. Second best, and often more honest than a single study, since single published effects skew large.
- Cohen’s conventions. Acceptable when nothing else exists, and only if you say that is what you are doing.
G*Power reproduces Cohen’s conventions as tooltips on the effect-size field. The values differ by test, which is exactly the trap — an f of .25 and a d of .25 are not the same size of effect:
| Test family | Measure | Small | Medium | Large |
|---|---|---|---|---|
| t test, two means | d | 0.2 | 0.5 | 0.8 |
| ANOVA, fixed effects | f | 0.10 | 0.25 | 0.40 |
| Multiple regression | f² | 0.02 | 0.15 | 0.35 |
| Correlation | ρ | 0.1 | 0.3 | 0.5 |
The manual itself carries the caveat, and you should carry it into your write-up: these conventions “may have different meanings for different tests”. For ANOVA there is also a conversion worth knowing, because your literature will report η² and G*Power wants f: η² = f²/(1 + f²), or f = √(η²/(1 − η²)). Where you go looking for those published effects is the same place you built your chapter two from — see our step-by-step guide to the literature review for the Canadian collections most students never search.
What if I can only recruit the number I can get?
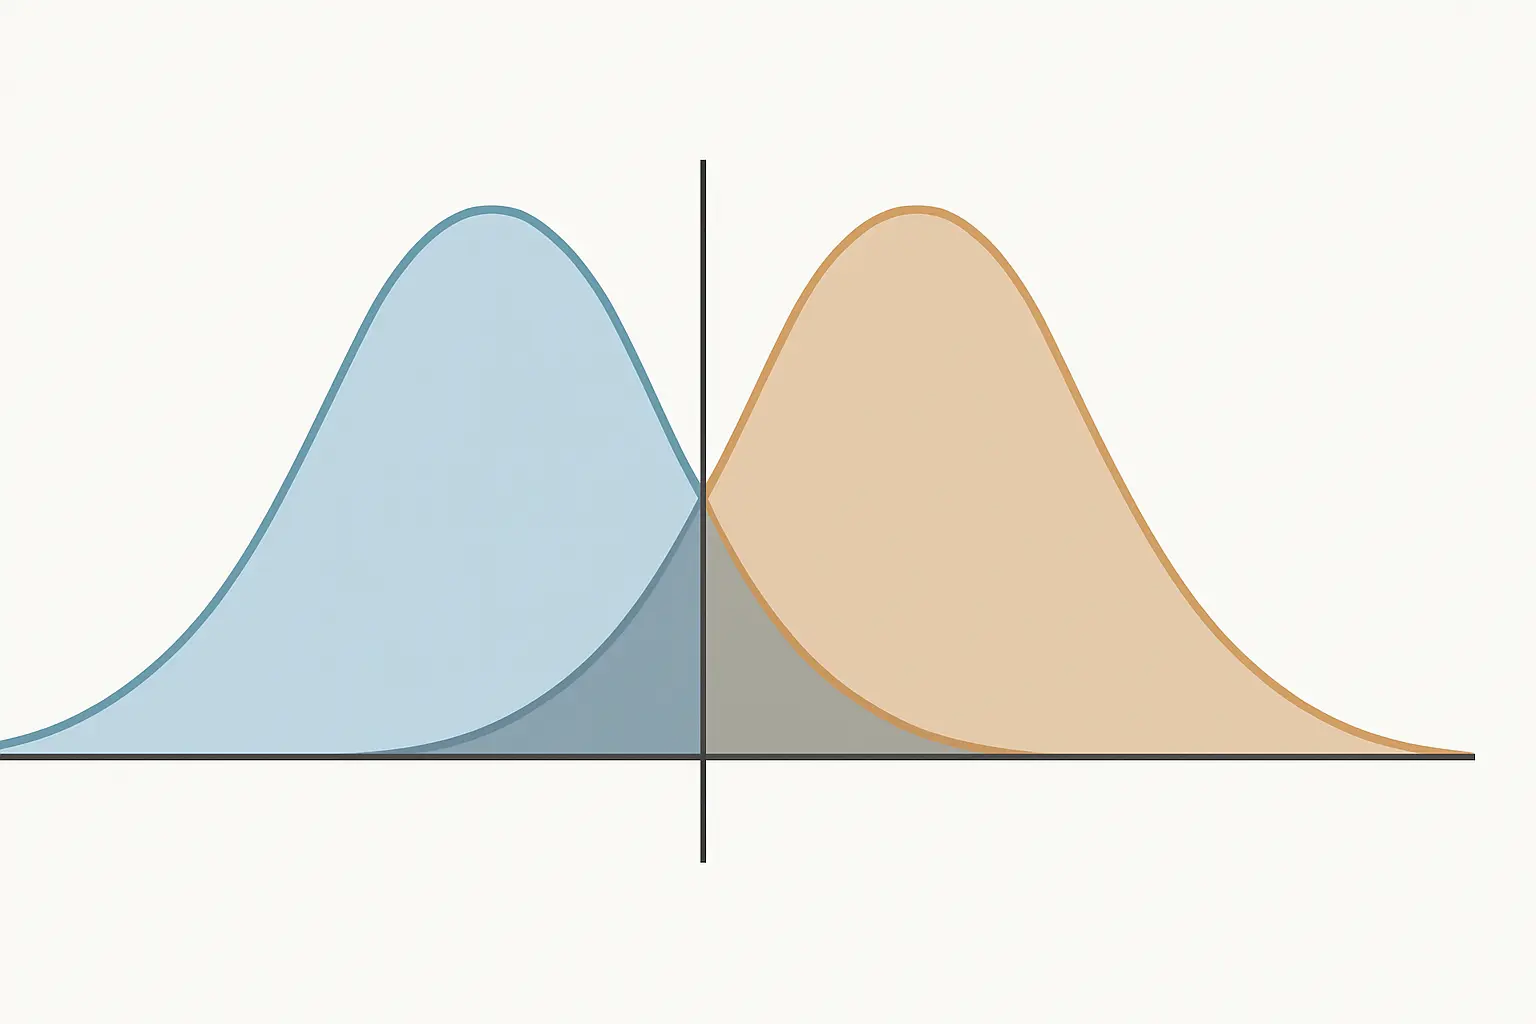
This is the real situation for most thesis students. Your population is the 60 nurses in one hospital unit, or the 43 responses your survey actually attracted, or a secondary dataset whose N was decided by somebody else years ago. An a priori analysis telling you that you needed 176 is now useless.
Run a sensitivity analysis instead. You give G*Power your α, your desired power and your actual N, and it returns the smallest effect you could have detected. That single number turns a limitation into a stated design parameter: rather than “my sample was small”, you can write “with N = 60, α = .05 and power = .80, the minimum detectable effect was d = 0.74; effects smaller than that would not have been reliably detected, which is a limitation of this design.”
An examiner will accept that sentence, because it shows you understand the consequence of your own N. It is also the right move for an existing dataset — with a Statistics Canada file the N is a given, and our guide to getting Statistics Canada data for a thesis covers which tier fixes it at what size.
Should I run a post hoc power analysis after collecting data?
Not the version most students mean. Computing power from the effect size you happened to observe in your own sample — often called observed or retrospective power — has been criticised in the statistical literature for a quarter of a century. The standard reference is Hoenig and Heisey’s “The Abuse of Power” in The American Statistician (2001, vol. 55, pp. 19–24), which shows that power calculated from the observed effect is a direct function of the p value and therefore adds no information: a non-significant result will always yield low observed power, so reporting it explains nothing.
If a committee member asks for post hoc power, the useful response is to offer the sensitivity analysis above, along with the confidence interval around your effect. A wide interval that includes both trivial and substantial effects tells the reader precisely what your sample could and could not resolve.
How many interviews are enough for a qualitative thesis?
There is no equivalent calculation, and the honest position has shifted in the last few years. Braun and Clarke, whose reflexive thematic analysis is the most widely used qualitative method in Canadian graduate work, state on their own methods site that there is “no easy answer to the question of dataset size”, and recommend avoiding claims of “saturation” — pointing readers instead to the concept of information power.
Their position is set out in “To saturate or not to saturate? Questioning data saturation as a useful concept for thematic analysis and sample-size rationales” (Qualitative Research in Sport, Exercise and Health, 2021, 13(2), 201–216). The practical consequence for your methods chapter is direct: the sentence “data collection continued until saturation was reached” is now a liability rather than a safe formula, because a reflexive-TA examiner may ask you to justify a concept your own method’s authors have disowned.
The alternative they point to is Malterud, Siersma and Guassora’s information power model (Qualitative Health Research, 2016, 26(13), 1753–1760). Its core claim is that the more information a sample holds relevant to the study, the fewer participants you need — and it makes that assessable through five dimensions:
- The aim of the study — a narrow aim needs fewer participants than a broad one.
- Sample specificity — a densely specific sample carries more relevant information per person.
- Use of established theory — a study resting on established theory needs less data than one building theory.
- Quality of dialogue — strong, articulate interview data carries more information than thin data.
- Analysis strategy — an in-depth analysis of a few cases needs fewer participants than a cross-case comparison.
Their design guidance makes the trade-off concrete: smaller datasets of information-rich items and larger datasets of thinner ones are both coherent choices. What is not coherent is a number with no argument attached.

What does my REB actually check about my sample size?
Less than students fear, and something more specific than they expect. TCPS 2 (2022) Article 2.7 states that “as part of research ethics review, the REB shall review the ethical implications of the methods and design of the research.” The ethical implication of a sample size runs in both directions: recruiting more participants than the question requires imposes burden for no gain, and recruiting so few that the study cannot answer anything imposes burden for no purpose.
But the scholarly judgement is not the board’s. The same article’s application notes that for student research, scholarly review is normally the job of “the research supervisor or thesis committee”, and that research in the humanities and social sciences posing at most minimal risk “shall not normally be required by the REB to be peer reviewed”. So the board asks whether your number is ethically defensible; your committee asks whether it is methodologically defensible. Prepare both answers, and see our guide to REB approval and TCPS 2 for whether your project needs review at all.
How do I write the justification?
Three or four sentences, in the methods chapter, before you describe recruitment. Quantitative version:
An a priori power analysis was conducted in G*Power 3.1.9.7 (Faul, Erdfelder, Lang, & Buchner, 2007). Assuming a medium effect (f = .25), α = .05 and power = .80 for a one-way ANOVA with three groups, the required total sample was 159. Recruitment closed at 164 usable responses.
Qualitative version:
Sample size was determined by information power (Malterud et al., 2016) rather than by saturation. The study aim was narrow, participants were selected for high specificity, and analysis was in-depth rather than cross-case, all of which reduce the number of participants required. Data collection concluded at 14 interviews, at which point the dataset supported the depth of analysis the research question required.
Cite the version of G*Power you actually ran, and cite the program properly — the authors ask for Faul, Erdfelder, Lang and Buchner (2007) in Behavior Research Methods, 39, 175–191, and, for correlation and regression analyses, Faul, Erdfelder, Buchner and Lang (2009), 41, 1149–1160. Which statistics package you run the analysis in afterwards is a separate decision, covered in our comparison of SPSS, R, jamovi and Stata for a Canadian thesis.
Writing the methods chapter around those numbers — keeping the justification, the recruitment account and the analysis plan consistent as the design shifts — is the slow part. Draft your methods chapter in Tesify and keep the structure and references consistent while every methodological decision remains 100% yours.
Frequently asked questions
How many participants do I need for a master’s thesis?
There is no fixed number. For quantitative work it is whatever an a priori power analysis returns for your design, expected effect size, alpha and target power. For qualitative work it is whatever you can justify by an information-power argument.
Is 30 participants enough for a thesis?
It depends entirely on the effect you are looking for. Thirty is plenty to detect a very large difference and far too few to detect a small correlation. Run a sensitivity analysis at N = 30 and you will see exactly which effects it can and cannot resolve.
Does G*Power work on an Apple silicon Mac?
The current macOS release, 3.1.9.6, was compiled for Intel processors and runs under translation. The authors note Apple supports Intel-built applications until macOS 28, expected in autumn 2027, and that a native version, G*Power 4, is in development.
What is the difference between a priori and sensitivity analysis?
A priori computes the sample size you need from a target effect size. Sensitivity computes the smallest effect you could detect from the sample size you have. Use the first when planning and the second when your N is already fixed.
Why is post hoc power criticised?
Because power computed from your own observed effect is a function of the p value, so it tells the reader nothing they did not already know. Hoenig and Heisey set this out in The American Statistician in 2001.
How many interviews for a qualitative thesis?
There is no number. Braun and Clarke advise against claiming saturation and point to information power instead, which asks how much relevant information your sample holds rather than how many people are in it.
Does my REB decide whether my sample is big enough?
The REB reviews the ethical implications of your methods and design under TCPS 2 Article 2.7. The methodological judgement on your number is normally your supervisor’s and committee’s.
My response rate collapsed. What do I write?
Report the achieved N, run a sensitivity analysis, and state the minimum detectable effect as a limitation. A stated limitation is a stronger position than a silent one.