
The test is chosen by your design, not by your data. Two groups measured once: independent-samples t-test. The same students measured twice: paired t-test. A pretest you want to control for: ANCOVA. Three or more groups: one-way ANOVA. Students nested in classrooms: multilevel modelling. Categorical outcome: chi-square or logistic regression.

Why is the test decided by your design rather than by your data?
Because the analysis is a promise you made in Chapter 3. By the time you have data, the number of groups, the number of measurement points, the level of measurement of your outcome and the sampling structure are all fixed, and those four facts determine the test almost completely. Running several tests and keeping the one that came out significant is not analysis; an examiner who sees a test in your results that does not appear in your methods will ask why.
Education theses go wrong at a predictable point: students describe a quasi-experimental design with intact classes, then analyse it as though they had randomly assigned individual pupils. The design is defensible; the analysis that ignores the class the pupil sits in is not, and it is the most common methodological criticism at a Canadian education defence.
What is the decision table for an education thesis?
| Design you actually ran | Outcome | Test | Effect size to report |
|---|---|---|---|
| One class before and after an intervention | Continuous score | Paired-samples t-test | Cohen’s d for repeated measures |
| Intervention class vs comparison class, posttest only | Continuous score | Independent-samples t-test | Cohen’s d |
| Intervention vs comparison, pretest and posttest | Continuous score | ANCOVA with pretest as covariate | Partial eta squared |
| Three or more teaching conditions | Continuous score | One-way ANOVA plus a planned post hoc | Eta squared |
| Two conditions measured at three time points | Continuous score | Mixed (split-plot) ANOVA | Partial eta squared |
| Pupils nested in classes or schools | Continuous score | Multilevel model with a random intercept | Intraclass correlation plus standardised coefficients |
| Predicting achievement from several teacher and pupil variables | Continuous score | Multiple regression | R squared and standardised beta |
| Predicting a pass or fail, a referral, a drop-out | Binary | Binary logistic regression | Odds ratio with confidence interval |
| Comparing proportions across streams or programmes | Categorical | Chi-square test of independence | Cramer’s V |
| Relationship between two continuous variables | Continuous | Pearson correlation | r, reported with its confidence interval |
Mark the row your design sits in and turn it into the sentence that justifies your analysis plan. If no row fits, your design is more complicated than you think, and the conversation to have with your supervisor is about the design rather than the software.
When do you need ANCOVA rather than a gain-score t-test?
Whenever you have a pretest and non-equivalent groups, which in school-based research is almost always. Subtracting pretest from posttest and running a t-test on the difference treats every pupil’s starting point as irrelevant, and it throws away the fact that low scorers tend to gain more simply because they had further to travel.
ANCOVA keeps the pretest in the model as a covariate and asks the sharper question: given two pupils who started at the same place, does the intervention group finish higher? Two conditions matter. The covariate must be measured before the intervention, not contaminated by it. And the homogeneity-of-regression-slopes assumption requires the pretest-to-posttest relationship to be similar in both groups; test the group-by-pretest interaction, and if it is significant, report that the intervention worked differently for different starting levels rather than hiding it.
What do you do when pupils are nested in classrooms?
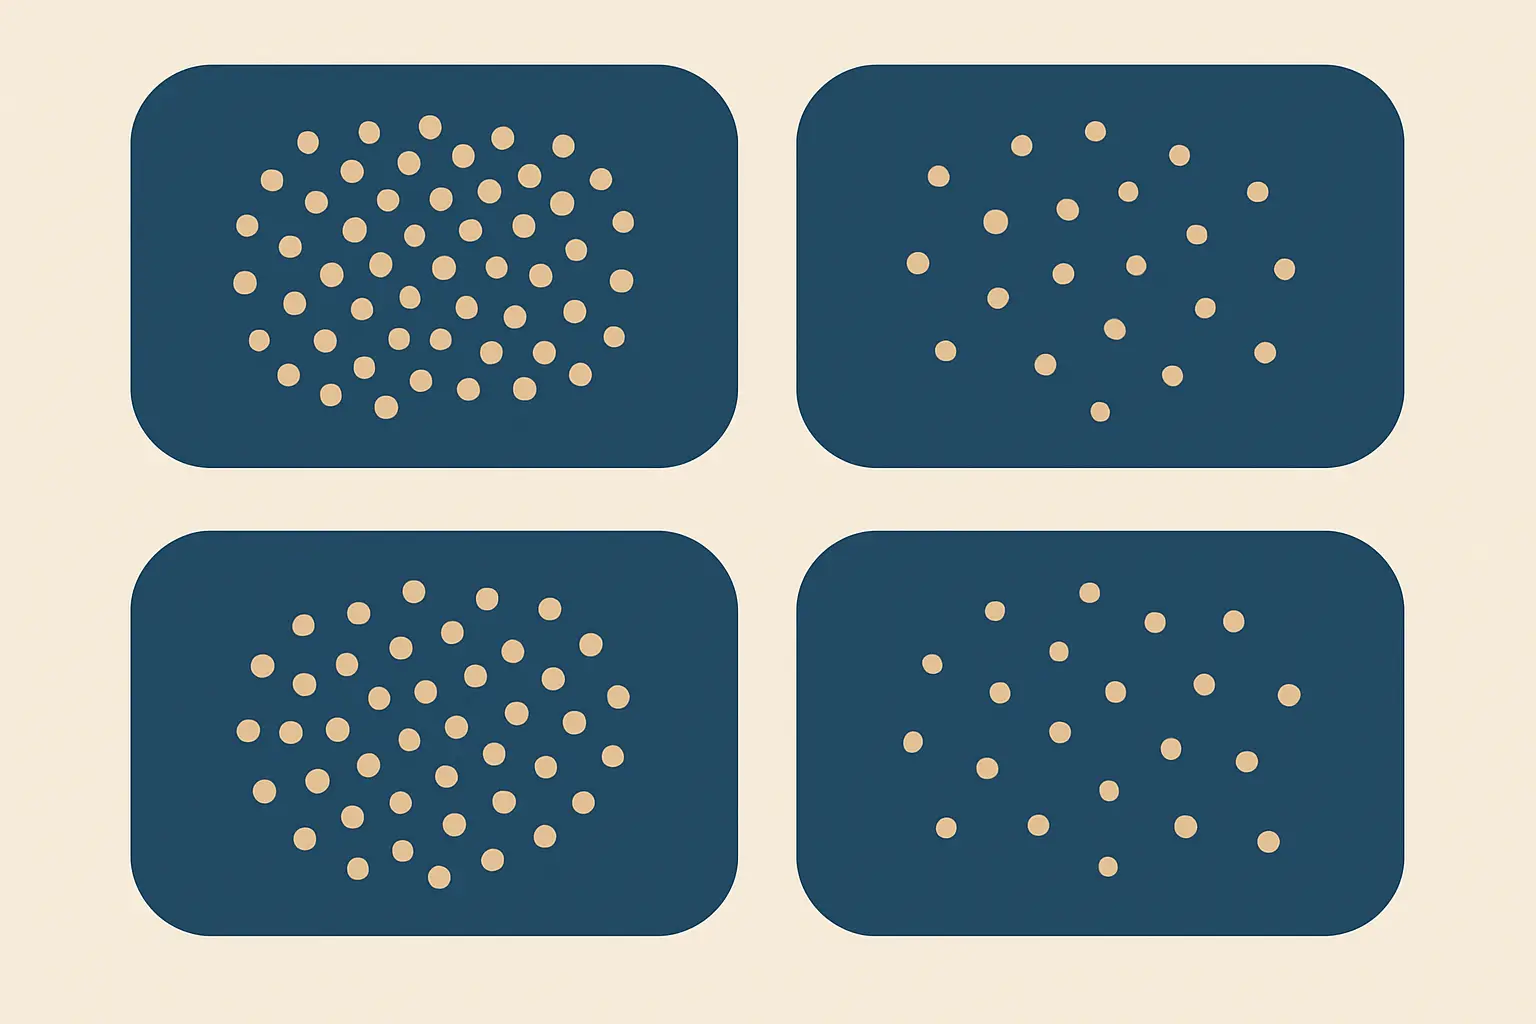
You acknowledge the nesting, then either model it or explain in your limitations why you could not. Twenty-eight pupils taught by one teacher are not twenty-eight independent observations: they share an instructor, a room, a timetable and a peer group, which makes their scores more similar to each other than to scores from another class. Treating them as independent shrinks your standard errors artificially and inflates your Type I error rate.
The diagnostic is the intraclass correlation coefficient, calculated from an empty multilevel model with no predictors. It reports the proportion of total variance in the outcome that sits between classes rather than within them. Report the value. If a meaningful share of variance is between classes, fit a two-level model with a random intercept for class; if you have too few classes to do that credibly, say so plainly, use cluster-robust standard errors if your software offers them, and treat the limitation as a finding about what your data can support.
How many classes is enough is a design question, not an analysis question. The mechanics of working it out backwards from your planned analysis are set out in the guide to how many participants a thesis actually needs.
Which test fits a survey of teachers built from Likert items?
It depends on whether you are analysing single items or a scale. A single Likert item is ordinal: five ordered categories, with no guarantee that the gap between agree and strongly agree equals the gap between neutral and agree. Compare single items across two groups with a Mann-Whitney U test, and across three or more with a Kruskal-Wallis test.
A scale is different. When several items are summed or averaged into one score you have shown to be internally consistent, the composite is conventionally treated as continuous and analysed with the parametric tests above. That treatment is only defensible if you demonstrated the internal consistency in your own sample, which is where many education theses lose marks; the thresholds and what to do about a weak subscale are covered in the explainer on what counts as an acceptable Cronbach’s alpha.
What if your outcome is a category rather than a score?
Education research is full of categorical outcomes: pass or fail, promoted or retained, referred or not referred, enrolled in the academic or the applied stream. Use the chi-square test of independence when you want to know whether two categorical variables are associated, and report Cramer’s V so the reader knows how strong the association is. Check the expected-count condition first: if too many cells fall below an expected count of five, the approximation is unreliable and Fisher’s exact test is the correct substitute for a two-by-two table.
Use binary logistic regression when you want to predict the category from several variables at once. It lets you ask whether attendance still predicts course failure once you have adjusted for prior achievement and socio-economic indicators. Report odds ratios with confidence intervals rather than raw coefficients, and remember that an odds ratio is not a risk ratio.
How do you compare more than two groups without inflating your error rate?
Run one omnibus test first, then a planned comparison procedure. Three separate t-tests across three teaching conditions give you three chances to find a spurious difference, and the probability of at least one false positive climbs well above the five per cent you claimed. The sequence is: one-way ANOVA to establish whether the groups differ at all, then a post hoc procedure to establish which pairs differ. Tukey’s HSD is standard when group sizes and variances are comparable; Games-Howell is the honest alternative when variances are unequal, which happens routinely when one condition is a small pull-out group. The step-by-step version in software, with the finished results paragraph, is in the walkthrough of how to run and report a one-way ANOVA.
When do you actually need a non-parametric test?
Less often than students assume. The parametric family assumes that the residuals are approximately normal, not that your raw scores are, and with reasonably sized groups means behave well even when the underlying distribution is skewed. Three situations genuinely call for the non-parametric route: the outcome is ordinal by construction, as with a single Likert item or a rubric band; the groups are very small, so the appeal to large-sample behaviour is not available; or the distribution is severely skewed by a floor or ceiling effect, which is common in classroom assessment.
Pair each parametric test with its counterpart: Mann-Whitney U for the independent t-test, Wilcoxon signed-rank for the paired t-test, Kruskal-Wallis for one-way ANOVA, Friedman for repeated measures, Spearman’s rho for Pearson correlation. Unequal variances are not on that list: the correct response there is Welch’s t-test, which the major packages now offer by default.
What do you report alongside the p value?
Four things, every time: the test statistic with its degrees of freedom, the exact p value rather than a threshold, an effect size, and a confidence interval. A statement that an intervention worked because p was below .05 tells an examiner nothing about whether the difference is large enough to change what a teacher does on Monday morning. Report Cohen’s d or partial eta squared, interpret it against effect sizes typically found in classroom intervention studies rather than against generic labels, and say plainly when a significant result is too small to matter.
Where do Canadian education datasets change the answer?
They change it in one specific way: large-scale assessment data arrives already clustered and already weighted, and analysing it as a simple random sample is wrong.
The Pan-Canadian Assessment Program, administered by the Council of Ministers of Education, Canada, assesses mathematics, reading and science on a rotating cycle in which one subject is the major domain and the other two are minor domains; PCAP 2023 is the most recent completed cycle. Canada also participates in PISA, PIRLS and TIMSS, and several provinces run their own assessments, Ontario’s EQAO among them. All use complex sampling designs with schools as the primary sampling unit, and the international studies report achievement as plausible values rather than as a single score per pupil.
Two consequences follow. Use the survey weights supplied with the file, and the replicate weights for variance estimation, or your standard errors will be too small. And where the file supplies plausible values, run the analysis across all of them and combine the results. If you are drawing on Statistics Canada holdings instead, the access route and file types are mapped in the guide to Statistics Canada microdata for a thesis.
How do you write the analysis paragraph in your methodology chapter?
Name the test, name the design feature that forced it, name the assumption checks, and name the effect size. Here is a worked example you can adapt.
Because the two Grade 6 cohorts were intact classes rather than randomly assigned individuals, and because a pretest was administered in September, the primary analysis is an analysis of covariance with posttest score as the dependent variable, condition as the fixed factor and pretest score as the covariate. Homogeneity of regression slopes will be assessed by testing the condition-by-pretest interaction before interpreting the main effect. Effect size will be reported as partial eta squared with a 95 per cent confidence interval. Because pupils are nested within four classrooms, the intraclass correlation will be reported from an unconditional two-level model, and the limitations section will address the small number of clusters.
That paragraph belongs in the data analysis section of your methods, inside the wider structure described in the walkthrough of how to write the methodology chapter of a Canadian thesis. Which package you run it in matters less than most students fear, and the trade-offs are laid out in the comparison of statistics software for a Canadian thesis.
Can Tesify help you write the analysis section?
Choosing the test is a decision only you can make, but turning that decision into defensible chapter prose is what Tesify is built for: the analysis paragraph, the assumption-checking sentences, the results write-up in APA form and the limitations paragraph that follows from a clustered design.
Draft your analysis chapter with Tesify
Frequently asked questions
Do I have to test for normality before every t-test?
No. Formal normality tests are oversensitive in large samples and underpowered in small ones, which is the opposite of what you need. Inspect a histogram and a Q-Q plot of the residuals, report what you saw, and reserve a formal test for cases where the visual evidence is genuinely ambiguous.
My sample is 40 pupils. Do I have to use non-parametric tests?
Not automatically. Forty is small but not tiny, and the parametric tests hold up reasonably well unless the distribution is badly skewed or the outcome is ordinal by construction. Look at the shape of the residuals rather than at the sample size alone, and if you switch, say why in one sentence.
Can I run a t-test on a single Likert item?
You will find published papers that do, and you will find reviewers who object. The defensible position for a thesis is to treat single items as ordinal and use Mann-Whitney or Kruskal-Wallis, and to reserve parametric tests for multi-item scales whose internal consistency you have demonstrated in your own sample.
What is the difference between a mixed ANOVA and a multilevel model?
A mixed ANOVA handles one repeated-measures factor and one between-groups factor with complete data and equal spacing. A multilevel model handles nesting of any kind, tolerates missing occasions, and lets slopes as well as intercepts vary. If your only complication is measurement at three time points, the mixed ANOVA is enough; if pupils sit inside classes inside schools, it is not.
My intervention group started higher. Can ANCOVA fix that?
It adjusts for the measured difference; it does not fix the underlying non-equivalence. ANCOVA cannot control for what you did not measure, and pre-existing group differences usually travel with other unmeasured differences. Use it, report the adjusted means, and state the limitation honestly rather than claiming the adjustment made the groups equivalent.
Do I need to correct for multiple comparisons if I have several outcomes?
If the outcomes are testing one hypothesis, yes: either apply a correction or designate one primary outcome in advance and label the rest exploratory. Designating a primary outcome in your proposal is usually the better route, because it protects your error rate without stripping power from the comparison you most care about.
Can I run a chi-square test if one of my cells is nearly empty?
Not reliably. The approximation depends on adequate expected counts. Collapse categories where collapsing is substantively meaningful, or use Fisher’s exact test for a two-by-two table.
Do I need to report a power analysis for a dataset I did not collect?
Not a prospective one, but report the smallest effect your available sample could reliably detect. That is far more informative than a post hoc power calculation, which only rearranges the p value you already have.